At the moment it does not appear that the foundation publish details of grants in an open machine-readable format, but a short description of each grant is provided on the website. Using ScraperWiki and a little programming know-how we can write a screen-scraper which reads the site and assembles a dataset of all the grants it can find.

ScraperWiki is a service allowing anyone to write a ‘screen scraper’ – a bit of code which tries to extract data from another website. Scraper Wiki run our scraper once every day, making sure our dataset is updated.
[View the results of the scraper here...]
 Scraper Wiki gives us the option to download our dataset, or explore it as an online Google Spreadsheet.
By opening up the document as a Google Spreadsheet we can:
- Sort and filter the data;
- Clean up any rows which contain errors;
- Use the google chart features to perform basic visualisation of the data
Google Spreadsheets also provide an easy way to publish data on the web. If we had the original data in a structured format we could have uploaded it as a Google Spreadsheet straight away – removing the need to screen scrape data.
Using the sharing settings in Google Spreadsheets we can make our data available for others to access (read-only, or with permission to edit it) and we can publish it back onto a website.
Data press is a WordPress plugin for exploring data. It allows ‘faceted browsing’ of a dataset. It can read data from specially formatted Google Spreadsheets.
We changed in the headings in the Google Spreadsheet generated by Scraper Wiki to datapress format and followed the instructions here to create the ‘Exhibit’ display below.
To allow us to use a ‘tag’ facet we created an extra column in our Google Spreadsheet and used the rather lengthy formula:
=LOWER(SUBSTITUTE( SUBSTITUTE( SUBSTITUTE( SUBSTITUTE( SUBSTITUTE(E192,” ”,”;”),”.”,”"),”(“,”"),”)”,”"),”‘”,”"))
in order to turn the descriptions into a series of lowercase words without punctuation separated by ‘;’ to that datapress would treat them as key-word tags.
Click the Exhibit to load it full-screen and explore the data.
Exhibit is only really designed to handle datasets of up to 500 or so items as it all runs in your web browser, so our dataset of over 3000 items places a strain on it. However, similar server-based interfaces can easily be created.
The Open Charities project have created a dataset of all UK Charities including, where available, details of their income and expenditure, taking the data from the Charity Commission website.
Using Google Fusion Tables we can combine data on Esme Fairbairn Foundation grants, with details of any charities those grants went to.
First we had to load our Google Spreadsheet into Fusion Tables. This is straighforward as Google provide a direct import from Spreadsheets. Fortunately for us, the Open Charities dataset was already available on Fusion Tables.
As Fusion Tables uses fairly simple matching to merge two tables, and Open Charities has charity names in upper case, we had to create an updated version of our original spreadsheet, using the =UPPER() formula in Google Spreadsheets to create a column with uppercase organisation names.
It’s then a simple process of telling Fusion Tables which values to use to create a merged table:

The resulting table had over 1000 rows in where the name of the organisation given a grant by Esme Fairbairn Foundation matched with the name of a UK Charity.
Matching by name isn’t 100% reliable. Ideally we would match details using a charity number if this was available. We could also explore using other tools like Freebase Gridworks to try and match grant recipients with Wikipedia pages about them in Freebase, as the image below shows:
 We cleaned up the merged table by downloading a copy and removing all the non-matched lines and then uploading it again.
Geocoding converts an organisation name or address to a geographic location that can be plotted on a map.
Fusion Tables has a geocoder built in. Initially we tried asking Fusion Tables to ‘geocode’ based on the names or organisations (it uses Google’s index to check if it has any location information about something of the same name: you can get the same effect with a =GoogleLookup(“Location”,”Placename”) in Google Spreadsheets), but this wasn’t very accurate (lots of organisations with the same names in different parts of the world).
However, once we had merged in charity details from Open Charities, we had addresses with postcodes against all the grants to charities. These were easier to geocode.
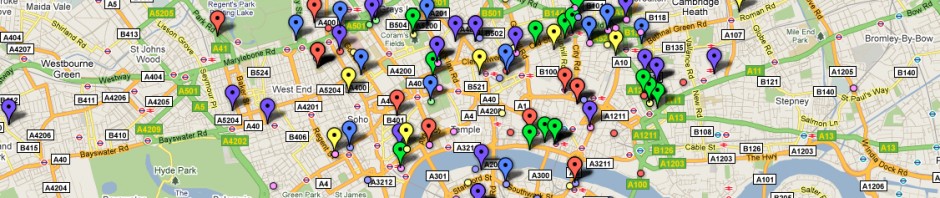
As a result, we could then create a map visualisation of the data such as the one below which shows each year of grants to charities in a different colour, and provides details of the grant, and of the charity, when the icons are clicked.
Other visualisations are also possible (although because of the nature of our data with only years rather than discrete months for grant dates none work as easily). For example, a motion chart shows the changing categories and amounts of grant spending over time.
There are many more possibilities for the data we’ve been exploring.
For example, loaded into statistical software (and cleaned up more) it could be used to explore how much of a charities income grants from the Foundation made up in a given year. Or, if we could merge non-charity grants with details of those organisations, it could be used to explore the difference between grants to charities and other organisations.
We could explore how photos, media and reports from Flickr and other websites could be attached to unique grant identifiers and displayed on the Foundation’s website to give a visual impression of the impact of the grantmaking.
One way to explore the impact of grantmaking is to see what grant recipients are saying about the Foundation on their websites. Because Open Charities provides websites URLs for many charities, we can take the list of website addresses from our merged Fusion Table and use this to create a Google Custom Search Engine (CSE) that searches just the websites of grant recipients.
Try searching for ‘Esme Fairbairn’ in the search engine below. Or perhaps if your interest has been piqued by something you saw in the other visualisations, search for a particular topic.
Loading
What else would you like to do with the data?